From a closed economy with a per capita GDP of $156 in 1978, China has transformed into a global powerhouse by 2024, boasting a per capita GDP of $13,400. As the world’s largest exporter, second-largest importer, and third-largest outbound investor, China’s economic influence is undeniable. Its manufacturing GDP share surged from 8% in 2004 to 30% in 2021, reshaping global trade and investment.
In 2025, new trade patterns and Belt and Road initiatives drive deeper ties with developing nations, redefining China’s role. Discover how trade shifts, investment surges, and industrial spillovers position China as a leader in the global economy.
Trade Evolution: From Labor to Capital
In 1978, China’s trade was modest, with exports and imports at $10 billion each, a mere 1% of global trade. By 2023, exports hit $3.56 trillion (15% of global share) and imports reached $2.71 trillion (11%), yielding an $800 billion trade surplus in 2024.
Early 1990s trade followed a “two-heads-out” model: importing capital and intermediate goods from high-income nations and exporting labor-intensive consumer goods. By 2004, capital goods peaked at 40% of imports but dropped to 30% by 2024, while raw materials like oil and lithium surged, driven by electric vehicle demand.
Exports shifted dramatically: consumer goods’ share plummeted, while capital goods, like machines, rose to 41% of exports by 2004, dominating ever since. This reflects China’s growing capital-intensive advantage, moving from “four billion shirts for one Boeing” to high-tech exports.
Trade with developing nations also deepened. From 2000 to 2023, low- and middle-income countries’ share in China’s capital goods exports jumped from 16.5% to 41.5%, supporting their industrialization. Meanwhile, global South nations became key raw material suppliers, forming a complementary trade network.
Investment Surge: From Mergers to Greenfields
China’s outward direct investment (ODI) soared from a few billion dollars in 2000 to $170 billion in 2024, surpassing inbound FDI and trailing only the US and Netherlands. By 2023, cumulative ODI reached $2.96 trillion.
Early investments (2004-2011) focused on mergers and acquisitions, peaking at 42% of ODI, enabling Chinese firms to acquire advanced technologies, brands, and market channels. Post-2013, the Belt and Road Initiative boosted greenfield investments, with manufacturing ODI rising from 7.8% in 2014 to 15.5% by 2023, driven by rising domestic labor costs and geopolitical tensions.
These investments support global South industrialization, providing capital goods and infrastructure, aligning with China’s shift from participant to leader in global economic governance.
Industrial Spillover: A New Global Pattern
Global industrial transfer follows scale economies, concentrating production in hubs like Beijing or Shanghai, where costs eventually push industries outward. China, once a beneficiary of Hong Kong’s spillover, now drives multi-directional transfers to Southeast Asia, Latin America, and North America.
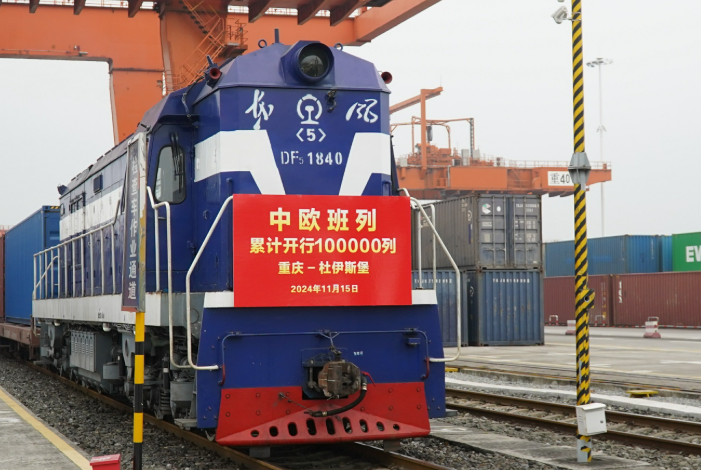
The Belt and Road Initiative accelerates this, with infrastructure investments cutting transport times by 8.5% and boosting FDI by 7.6% in partner nations, per a 2019 World Bank report. This lifted 7.6 million from extreme poverty and 32 million from moderate poverty, underscoring China’s role in global development.
Conclusion
China’s 2025 economic role reflects a shift from labor-intensive trade to capital-driven leadership. With $3.56 trillion in exports and $170 billion in ODI, China empowers global South industrialization via Belt and Road. As trade and investment patterns evolve, China’s influence grows—reshaping global markets. Explore this transformation’s impact today!